
7. Debugging#
“The most effective debugging tool is still careful thought, coupled with judiciously placed print statements.” — Brian Kernighan, co-creator of Unix
Some useful resources and nice histories:
Python debugging: https://www.youtube.com/watch?v=a7qIcIaL4zs
Interesting debugging stories:
My car is allergic to vanilla icecream: https://news.ycombinator.com/item?id=37584399
Bugs with real workd damage: https://news.ycombinator.com/item?id=36114641
More examples (500 miles email): http://beza1e1.tuxen.de/lore/index.html
The code worked differently when the moon was full: https://news.ycombinator.com/item?id=28686016
Top 10 bugs found in C++ projects in 2021: https://pvs-studio.com/en/blog/posts/cpp/0901/
Heisenbug: https://textual.textualize.io/blog/2023/02/11/the-heisenbug-lurking-in-your-async-code/
How to Report Bugs Effectively : https://www.chiark.greenend.org.uk/~sgtatham/bugs.html
Debugging with GDB: https://news.ycombinator.com/item?id=30512302
Reverse engineering: hugsy/gef
gdb breakpoint tricks: https://news.ycombinator.com/item?id=39170901
Spectre and meltdown: https://www.youtube.com/watch?v=YRohz9VO1YY
7.1. Examples to fix#
ICTP examples
Go to ICTP-examples, then go to debugging, then ICTP-gdbexamples , and download each file, or just download all files compressed at example files
These are more examples: original link
7.2. Example#
Fix the following code (first try to predict the problems and then use your current skills to catch the bug)
#include <iostream>
#include <cstdlib>

int main(int argc, char **argv)
{
  // declare variables
  const int N = 10;
  double * array;
  //reserve memory
  array = new double [N];
  // initialise array
  for (int ii = 0; ii < N; ++ii) {
    array[ii] = 2*(++ii); // != 2*(ii++) ?
  }
  // print some values
  int idx = 2;
  std::cout << array[idx] << std::endl;
  idx = 10;
  std::cout << array[idx] << std::endl; // compiles, but ...

  // free memory
  //delete [] array;

  return EXIT_SUCCESS;
}
7.3. Sanitizers#
Besides the typical printing to help debugging, a first helping hand would the compiler sanitizers. Try recompiling the previous code using the sanitizer flags as
g++ -fsanitize=address -fsanitize=leak -fsanitize=undefined source.cpp
and then run it
./a.out
Fo you observe something new? sanitizers check your code in runtime and help you find errors faster.
7.4. GDB (Gnu debugger)#
7.4.1. How to use gdb?#
Let’s use the following c++ code, called gdb_example_01.cpp:
#include <iostream>
#include <cstdlib>

int main(int argc, char **argv)
{
  // declare variables
  const int N = 10;
  double * array;
  //reserve memory
  array = new double [N];
  // initialise array
  for (int ii = 0; ii < N; ++ii) {
    array[ii] = 2*(++ii); // != 2*(ii++) ?
  }
  // print some values
  int idx = 2;
  std::cout << array[idx] << std::endl;
  idx = 10;
  std::cout << array[idx] << std::endl; // compiles, but ...

  // free memory
  delete [] array;

  return EXIT_SUCCESS;
}
To compile for debugging, you should use
$ g++ -g -ggdb gdb_example_01.cpp -o gdb_example_01.x
The flag -g tells the compiler to generate additional debugging
symbols to be used by the debugger. In addition, you can also specify
-ggdb to be more specific about the debugger symbols you want
(specific for gdb). Even more, you can also specify the debug level by
using -g3 (or -ggdb3). Default is 2. Level 3 allows for debugging fo
preprocessor macros.
Now, if you run your code
$ ./gdb_example_01.x
you will get the original output. The code does not have any error, and in principle it does not need debugging. But, you can still use the debugger to explore what your “correct” code is doing.
To attach gdb to your executable, run gdb as
$ gdb ./gdb_example_01.x
NOTE: gdb can also attach to already running process, by using the pid. For more info, see
man gdband maybeman ps.
This will bring to something similar to (this is for a Mountain Lion Mac os X machine)
GNU gdb (GDB) 7.5.1
Copyright (C) 2012 Free Software Foundation, Inc.
License GPLv3+: GNU GPL version 3 or later <http://gnu.org/licenses/gpl.html>
This is free software: you are free to change and redistribute it.
There is NO WARRANTY, to the extent permitted by law.  Type "show copying"
and "show warranty" for details.
This GDB was configured as "x86_64-apple-darwin12.2.0".
For bug reporting instructions, please see:
<http://www.gnu.org/software/gdb/bugs/>.
(gdb)
NOTE From now on, we will be inside the gdb console, so in the next examples please write the commands inside the gdb console. For example,
(gdb) stepmeans writestepinside the gdb console, and not(gdb) stepinside the shell.
Now, you are ready to go. First of all, keep in mind that your program is not yet running, it was just attached to gdb and all the debugging symbols were loaded. To actually run your program, you must write:
(gdb) run
NOTE: If your command needs command line arguments, you can run it as
(gdb) run [arglist], where[arglist]is the optional argument list.
And now you will get … guess … 0 again. Your program just ran up to
the end without any error. Now let’s get to the interesting part.
7.4.2. Breakpoints#
A breakpoint is a point in your source code where you want to stop the execution in order to check whatever condition you want (the value of a variable, the change in a variable, etc), or, for example, to continue the execution by steps. We will set a breakpoint at line 5 of our source code. This is as simple as writting
(gdb) break 5
and now run again the executable
(gdb) run
As you can see, the code now runs up to line 5, where gdb inform us we have reached the breakpoint. If you check the source code, we are in the line
int a;
that is, we are just declaring the variable a. What is its value at
this point? 0? 1? Let’s check
(gdb) print a
The value should be poor memory garbage, like 0xff2345 or similar. It depends on the machine. Now, if we move one step to the next line in the execution order
(gdb) next
we will be in the line a = 0. Let’s check again the value of variable
a
(gdb) print a
it should now print 0. As we can see, we can check the value of a local variable. In general, we will be able to check the value of both local and global variables.
Other examples for setting breakpoints:
Setting the break point at a given line of a given file:
(gdb) break gdb_example_XX.cpp:10
Setting a break point when calling a function:
(gdb) break function_name
Checking all breakpoints
(gdb) info breakpoints
Deleting a break point (the second one)
(gdb) delete 2
Ignore a given breakpoint (
3) for a number of times (100) (useful for iterations)
(gdb) ignore 3 100
Conditional break :
(gdb) break gdb_example_XX.cpp:5 if localvar == 10
7.4.3. Execution Control#
The instruction next tells gdb to advance in the execution order,
which also executes completely functions and returns to the main
function, while step goes inside the function step-by-step. Let’s
check the difference with another code (gdbexample02.cpp):
#include <iostream>

void do_something(int & var);

int main(int argc, char **argv)
{
  int a;
  a = 0;
  std::cout << a << std::endl;
  do_something(a);
  std::cout << a << std::endl;

  return EXIT_SUCCESS;
}

void do_something(int & var)
{
  int localvar = -1;
  var = 10.0;
}
Compile it with debugging symbols
$ g++ -g -ggdb gdb_example_02.cpp -o gdb_example_02.x
and attach to gdb
$ gdb ./gdb_example_02.x
Let’s make a breakpoint at line 9 and then run the code
(gdb) break gdb_example_02.cpp:9
(gdb) run
Now advance step by step and explore the variables at local level. Try
to check the difference between next and step exactly at the
function call.
(gdb) step
(gdb) step
(gdb) next
(gdb) ...
(gdb) print localvar
(gdb) print &localvar
You can also change the output format when printing a variable:
(gdb) p /d a
(gdb) p /t a
(gdb) p /x a
Add a break point at the function do_something. Compare the addresses
of the variables a and var inside the function do_something. Are
they the same or different? why?
Other control structures:
Watch for a change on a given variable:
(gdb) watch foo
Read-Watch for a given variable:
(gdb) rwatch foo
Read-Write-Watch for a given variable:
(gdb) awatch foo
Continue until next breakpoint:
(gdb) continue
Finish current function:
(gdb) finish
7.4.4. Other useful gdb commands#
(gdb) bt: Backtrace: display the program stack:(gdb) edit [file:]function: look at the program line where it is presently stopped.(gdb) help [name]: Show information about GDB command name, or general information about using GDB(gdb) quit: Exit from GDB.(gdb) list [file:]function: type the text of the program in the vicinity of where it is presently stopped.(gdb) call localfunction(): Calls a function calledlocalfunction()linked in the code.
7.4.5. Catching a segfault#
Sometimes, when you are lazy or sloppy with the memory you use, or when
you just have bad luck (some strange problems), you could face the
infamous Segementation fault error. Let’s see how the debugger can
help us to catch a segfault and to fix it!
First, please compile the following code (gdb_example_segfault.cpp):
#include <iostream>
#include <cstdlib>

int main(int argc, char **argv)
{
  // declare variables
  const int N = 10;
  double * array;
  //reserve memory
  array = new double [N];
  // initialise array
  for (int ii = 0; ii < N; ++ii) {
    array[ii] = 2*(++ii); // != 2*(ii++) ?
  }
  // print some values
  int idx = 2;
  std::cout << array[idx] << std::endl;
  idx = 10;
  std::cout << array[idx] << std::endl; // compiles, but ...

  // free memory
  delete [] array;

  return EXIT_SUCCESS;
}
Now compile and run gdb on it:
$ g++ -g gdb_example_segfault.cpp -o gdb_example_segfault.x
$ gdb ./gdb_example_segfault.x
(gdb) run
What happens? it runs, but then you are facing the terrible segfault error. What is the cause? let’s use gdb:
(gdb) where
Now it tell us that the problem is on line XXXXX. If we check our source code, that is the line where we are accessing element with index 10 on an array whose maximum index is 9 (since its size is 10), and therefore we are out the fence. Now comment or remove that line, recompile, and rerun on gdb. Is there any error?
You can also check the value of the iteration variables or related to
track better the error. But where is many times enough to point you to
the problem.
You can also test the effect of other variable value, by using set:
(gdb) break 15
(gdb) run
...
(gdb) set var idx = 4
(gdb) step
NOTE: If you do not get aby error but just strange results, try re-compiling your software with the flag -fsanitize=address -fsanitize=leak (only works recent for gnu compilers) and then you will catch the errors at running time.
Printing an array with gdb
Please try the following, where
arrayis the array name andlenis its lenght. Play with several values forlen:(gdb) print *array@len
Do you want to know the array size?
(gdb) ptype array
Please debug this code
    #include <iostream>

    int main(void)
    {
      //double x[10], y[5]; // imprime raro
      double y[5], x[10]; // imprime 1

      for(int ii = 0; ii < 5; ++ii) {
        y[ii] = ii +1;
      }
      for(int ii = 0; ii < 10; ++ii) {
        x[ii] = -(ii +1);
      }

      double z = x[10];
      std::cout << z << std::endl;

      return 0;
    }

    ```
7.5. Gdb Interfaces#
Tui mode
gdb -tui mode: Ncurses gui
Seer: https://github.com/epasveer/seer
Inside emacs
When having a file openned in emacs, press
M-xand write gdb, press enter. You will be presented with an example command to run gdb, modify it as you wish. Then, emacs will be yor debugger, and you can move from frame to frame by using the cursor orC-x o.Please check emacs gdb mode
Open your source code with emacs.
Compile with
M-x compile.Mis the meta function. By default it uses make, but you can modify the compile command.Activate de debugging:
M-x gdbDebug. To move from one frame to another you can use either the mouse or the shortcut
ctrl-x o. To close a pane, usectrl-x 0when inside that pane.
gdbgui
gdbfrontend
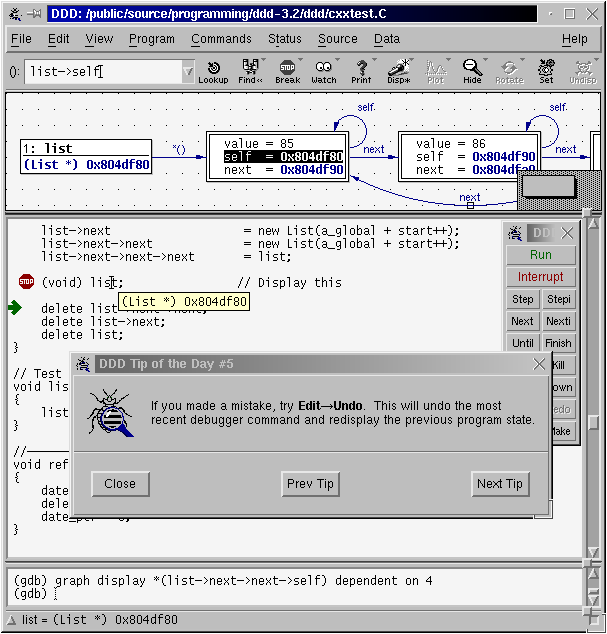
DDD : Data Display Debugger
Although dated, its great strenght is the ability to plot data with the command
grap plot dataarrayname, and check its evilution as the you debug.Others
Codeblocks, geany, clion, etc all them have interfaces for gdb.
Online gdb https://www.onlinegdb.com/
7.5.1. Other gdb tips#
7.5.1.1. Poor man’s profiler#
Get the process id:
$ top
or
$ ps aux
Attach the process to gdb (
PIDis the process id):
$ gdb -p PID
Now the program is paused.
check the stack:
(gdb) thread apply all bt
Check what appears first.
Continue the execution:
(gdb) continue
Repeat previous two steps as many times as you want and make a histogram of the most executed functions.
7.6. DDD : Data Display Debugger#
The Data Display Debugger - ddd is a graphical frontend for command line debuggers like gdb, dbx, jdb, bashdb, etc, and some modified python debugger. It easies the debug processing by adding some capabilities, like visual monitoring of data and data plotting (killer feature).
NOTE: DDD is hard to configure, it is so rebel. If after configuring some options you are having issues, like dd hanging with a message “Waiting for gdb to start”, or the plotting window is always waiting, then close ddd, delete the config file with
rm -rf ~/.ddd, and start over by configuring ONLY one option at a time (configure one option, then close it, then open, then configure other option, then close, etc).
7.6.1. Exercise#
Repeat the previous debugging exercises by using ddd. In particular, use
the display and watch. Do you find them convenient? and what about
graph display data?
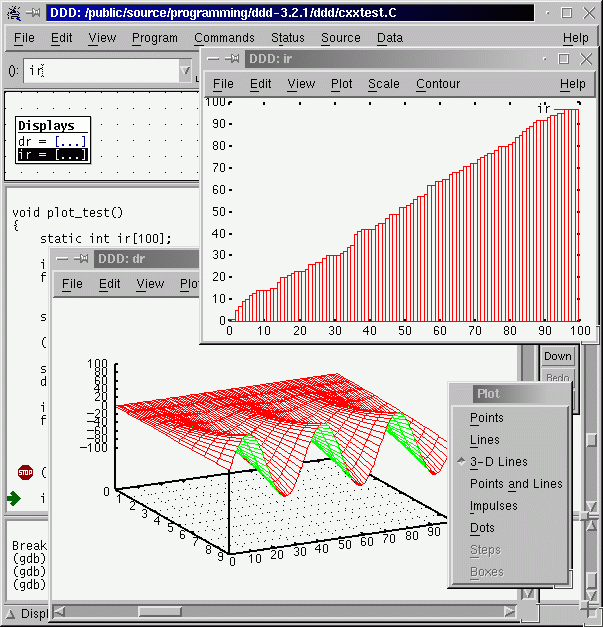
7.6.2. DDD data plotting with gnuplot#
One of the killer features of ddd is its capability to actually plot the data with gnuplot. Let’s do an example:
Compile (with debugging activated, of course) the code
array.cpp.Now open the executable with ddd.
Establish a break point at main.
Run the executable under ddd.
Now write
graph plot data, or equivalently, you can selectdatawith the mouse and then click to plot on the menu bar. NOTE : If you are having issues please try to configure gnuplot helper to be on an external window, then close, then re-open, and try again. Check also Notes above.Now proceed by steps. You will be able to see a plot of the array
dataas it changes its values. Awesome, isn’t it?Do the same for the 2d array. What will you expect now to be plotted? a line or a surface?
7.7. Valgrind#

From Web Page: > Valgrind is an instrumentation framework for building dynamic analysis tools. There are Valgrind tools that can automatically detect many memory management and threading bugs, and profile your programs in detail. You can also use Valgrind to build new tools.
The Valgrind distribution currently includes six production-quality tools: a memory error detector, two thread error detectors, a cache and branch-prediction profiler, a call-graph generating cache and branch-prediction profiler, and a heap profiler. It also includes three experimental tools: a heap/stack/global array overrun detector, a second heap profiler that examines how heap blocks are used, and a SimPoint basic block vector generator. It runs on the following platforms: X86/Linux, AMD64/Linux, ARM/Linux, PPC32/Linux, PPC64/Linux, S390X/Linux, MIPS/Linux, ARM/Android (2.3.x and later), X86/Android (4.0 and later), X86/Darwin and AMD64/Darwin (Mac OS X 10.6 and 10.7, with limited support for 10.8).
7.7.1. Graphical Interfaces#
7.7.2. As a memory checker#
In this section we will focus on valgrind as memory checker tool (debugging part). Therefore, we will invoke valgrind with that option:
$ valgrind --tool=memcheck --leak-check=yes myprog arg1 arg2
where myprog is your executable’s name, and arg1 etc are the
arguments.
We will use the files inside valgrind/Valgrind-QuickStart
Please compile the file a.c (which is also on the compressed file -
check wiki main page) and run valgrind on it. What do you obtain? Do you
have memory leaks? Please fix it until you have no memory errors.
Do the same for b.c .
Example : Memory leak
#include <iostream>
#include <cstdlib>

void getmem(double *ptr, int n);

int main(int argc, char **argv)
{
  // declare variables
  const int N = 10000;
  double * array;
  for (int ii = 0 ; ii < 20; ++ii) {
    getmem(array, N);
  }
  // free memory
  // delete [] array;

  return EXIT_SUCCESS;
}

void getmem(double *ptr, int n)
{
  ptr = new double [n];
  data[0] = data[1]*2;
}
More examples : ICTP
Please enter the
SoftwareCarpentry-ICTPvalgrind subfolder and locate the source files. CompilesimpleTest.ccas$ g++ -g simpleTest.cc -o simpleTest
Now run valgrind on it
$ valgrind --track-origins=yes --leak-check=full ./simpleTest 300 300
Check how the memory leaks depend on the parameters. Fix the code.
7.8. TODO Homework#
Modularize one of the previous codes into a header a implementation file and a main file. This will help when writing tests.