
18. Ref#
https://developer.nvidia.com/blog/multi-gpu-programming-with-standard-parallel-c-part-1/
https://www.youtube.com/watch?v=h9Z4oGN89MU : How does a gpu work
https://news.ycombinator.com/item?id=42042016
18.1. Environment setup for cuda#
Here I show two ways to setup the dev environment. One is based on a local computer with a graphics card, and the other using google collab.
Local environment
Here we will setup a computer which has an Nvidia Quadro P1000 card. You need to install both the driver and the cuda toolkit (the later better to be installed as a part of the nvidia sdk)
Driver download for quadro P1000: https://www.nvidia.com/Download/driverResults.aspx/204639/en-us/
Nvidia sdk: https://developer.nvidia.com/hpc-sdk-downloads
Nvidia singularity: This is the recommended way. The image is built at /packages/nvhpc23.3devel.sif. More instructions at https://catalog.ngc.nvidia.com/orgs/nvidia/containers/nvhpc
Accesing a shell inside the container but with visibility to all user account files:
singularity shell --nv /packages/nvhpc_23.3_devel.sif
Compiling
singularity exec --nv /packages/nvhpc_23.3_devel.sif nvc++ -g cuda_02.cu
Executing with nvprof
singularity exec --nv /packages/nvhpc_23.3_devel.sif nvprof ./a.out
Local module: Load the nvidia sdk (sala2):
module load /packages/nvidia/hpc_sdk/modulefiles/nvhpc/23.3
Compile as
nvc++ -std=c++17 -o offload.x offload.cpp
The docker container is installed. Unfortunately it does not run since the device compute capability is not enough
docker run --gpus all -it --rm nvcr.io/nvidia/nvhpc:23.3-devel-cuda_multi-ubuntu20.04
docker: Error response from daemon: could not select device driver "" with capabilities: [[gpu]].
More info about container: https://catalog.ngc.nvidia.com/orgs/nvidia/containers/nvhpc
Google collab
Open a collab notebook, go to runtime, change runtime type, hardware accelerator -> GPU, GPU type -> T4, Save. The you will have a runtime with a T4 card, for free. If you want an even better card, you can pay for collab pro.
Inside the notebook, you can run commands with the prefix
!to run then as in a console. For instance, to get the device properties, you can run!nvidia-smi
to get something like
+-----------------------------------------------------------------------------+
| NVIDIA-SMI 525.85.12    Driver Version: 525.85.12    CUDA Version: 12.0     |
|-------------------------------+----------------------+----------------------+
| GPU  Name        Persistence-M| Bus-Id        Disp.A | Volatile Uncorr. ECC |
| Fan  Temp  Perf  Pwr:Usage/Cap|         Memory-Usage | GPU-Util  Compute M. |
|                               |                      |               MIG M. |
|===============================+======================+======================|
|   0  Tesla T4            Off  | 00000000:00:04.0 Off |                    0 |
| N/A   44C    P8     9W /  70W |      0MiB / 15360MiB |      0%      Default |
|                               |                      |                  N/A |
+-------------------------------+----------------------+----------------------+

+-----------------------------------------------------------------------------+
| Processes:                                                                  |
|  GPU   GI   CI        PID   Type   Process name                  GPU Memory |
|        ID   ID                                                   Usage      |
|=============================================================================|
|  No running processes found                                                 |
+-----------------------------------------------------------------------------+
To create local files, like
filename.cu, use the magic%%writefile filename.cuat the beginning of the cell and then put the file contents in the same cell.Finally, to compile and run just execute the following
!nvcc filename.cu -o name.x
!nvprof ./name.x
18.2. TODO Cuda intro#
REF https://en.wikipedia.org/wiki/CUDA?useskin=vector Tutorial1: https://cuda-tutorial.readthedocs.io/en/latest/tutorials/tutorial01/ Tutorial2 https://developer.nvidia.com/blog/even-easier-introduction-cuda/
Tutorial 1
https://cuda-tutorial.readthedocs.io/en/latest/tutorials/tutorial01/ Example in c
Compile as
gcc example_01.cNow the same but in cuda:
Compile as
nvcc example_01.cuExecution will show errors, due to the fact that the code is NOT running on the device.
We need to allocate memory on it(
cudaMallocandcudaFree), and trasfer data to and from it (cudaMemCopy).Tutorial 2
https://developer.nvidia.com/blog/even-easier-introduction-cuda/
#include <iostream>
#include <math.h>

// function to add the elements of two arrays
void add(int n, float *x, float *y)
{
  for (int i = 0; i < n; i++)
      y[i] = x[i] + y[i];
}

int main(void)
{
  int N = 1<<20; // 1M elements

  float *x = new float[N];
  float *y = new float[N];

  // initialize x and y arrays on the host
  for (int i = 0; i < N; i++) {
    x[i] = 1.0f;
    y[i] = 2.0f;
  }

  // Run kernel on 1M elements on the CPU
  add(N, x, y);

  // Check for errors (all values should be 3.0f)
  float maxError = 0.0f;
  for (int i = 0; i < N; i++)
    maxError = fmax(maxError, fabs(y[i]-3.0f));
  std::cout << "Max error: " << maxError << std::endl;

  // Free memory
  delete [] x;
  delete [] y;

  return 0;
}
Compile as
g++ -g -std=c++17 cuda_01.cpp
Cuda example
#include <iostream>
#include <math.h>
// Kernel function to add the elements of two arrays
__global__
void add(int n, float *x, float *y)
{
  for (int i = 0; i < n; i++)
    y[i] = x[i] + y[i];
}

int main(void)
{
  int N = 1<<20;
  float *x, *y;

  // Allocate Unified Memory – accessible from CPU or GPU
  cudaMallocManaged(&x, N*sizeof(float));
  cudaMallocManaged(&y, N*sizeof(float));

  // initialize x and y arrays on the host
  for (int i = 0; i < N; i++) {
    x[i] = 1.0f;
    y[i] = 2.0f;
  }

  // Run kernel on 1M elements on the GPU
  add<<<1, 1>>>(N, x, y);

  // Wait for GPU to finish before accessing on host
  cudaDeviceSynchronize();

  // Check for errors (all values should be 3.0f)
  float maxError = 0.0f;
  for (int i = 0; i < N; i++)
    maxError = fmax(maxError, fabs(y[i]-3.0f));
  std::cout << "Max error: " << maxError << std::endl;

  // Free memory
  cudaFree(x);
  cudaFree(y);

  return 0;
}
To compile, use
nvc++.If you have a singularity container with the nvidia sdk, you can just run the following
singularity exec --nv /packages/nvhpc_23.3_devel.sif nvc++ -g cuda_02.cu
singularity exec --nv /packages/nvhpc_23.3_devel.sif ./a.out
singularity exec --nv /packages/nvhpc_23.3_devel.sif nvprof ./a.out
and get something like
==16094== NVPROF is profiling process 16094, command: ./a.out
Max error: 0
==16094== Profiling application: ./a.out
==16094== Profiling result:
            Type  Time(%)      Time     Calls       Avg       Min       Max  Name
 GPU activities:  100.00%  2.54774s         1  2.54774s  2.54774s  2.54774s  add(int, float*, float*)
      API calls:   93.27%  2.54776s         1  2.54776s  2.54776s  2.54776s  cudaDeviceSynchronize
                    6.71%  183.20ms         2  91.602ms  20.540us  183.18ms  cudaMallocManaged
                    0.02%  468.25us         2  234.13us  216.27us  251.98us  cudaFree
                    0.01%  213.75us       101  2.1160us     141ns  150.11us  cuDeviceGetAttribute
                    0.00%  32.127us         1  32.127us  32.127us  32.127us  cudaLaunchKernel
                    0.00%  22.239us         1  22.239us  22.239us  22.239us  cuDeviceGetName
                    0.00%  6.1330us         1  6.1330us  6.1330us  6.1330us  cuDeviceGetPCIBusId
                    0.00%  1.5730us         3     524ns     197ns  1.1650us  cuDeviceGetCount
                    0.00%     808ns         2     404ns     141ns     667ns  cuDeviceGet
                    0.00%     530ns         1     530ns     530ns     530ns  cuDeviceTotalMem
                    0.00%     243ns         1     243ns     243ns     243ns  cuDeviceGetUuid

==16094== Unified Memory profiling result:
Device "Quadro P1000 (0)"
   Count  Avg Size  Min Size  Max Size  Total Size  Total Time  Name
      48  170.67KB  4.0000KB  0.9961MB  8.000000MB  735.2380us  Host To Device
      24  170.67KB  4.0000KB  0.9961MB  4.000000MB  337.3770us  Device To Host
      24         -         -         -           -  2.855987ms  Gpu page fault groups
Total CPU Page faults: 36
You can also run it on google collab, where you will have an nvidia T4 card available for free (after changing the runtime), with the following typical output
==18853== NVPROF is profiling process 18853, command: ./cuda_02.x
Max error: 0
==18853== Profiling application: ./cuda_02.x
==18853== Profiling result:
            Type  Time(%)      Time     Calls       Avg       Min       Max  Name
 GPU activities:  100.00%  108.83ms         1  108.83ms  108.83ms  108.83ms  add(int, float*, float*)
      API calls:   72.48%  290.34ms         2  145.17ms  36.191us  290.31ms  cudaMallocManaged
                   27.17%  108.84ms         1  108.84ms  108.84ms  108.84ms  cudaDeviceSynchronize
                    0.28%  1.1298ms         2  564.90us  537.96us  591.84us  cudaFree
                    0.05%  182.13us       101  1.8030us     264ns  75.268us  cuDeviceGetAttribute
                    0.01%  48.553us         1  48.553us  48.553us  48.553us  cudaLaunchKernel
                    0.01%  28.488us         1  28.488us  28.488us  28.488us  cuDeviceGetName
                    0.00%  8.6520us         1  8.6520us  8.6520us  8.6520us  cuDeviceGetPCIBusId
                    0.00%  2.3140us         3     771ns     328ns  1.6230us  cuDeviceGetCount
                    0.00%     919ns         2     459ns     315ns     604ns  cuDeviceGet
                    0.00%     580ns         1     580ns     580ns     580ns  cuDeviceTotalMem
                    0.00%     532ns         1     532ns     532ns     532ns  cuModuleGetLoadingMode
                    0.00%     382ns         1     382ns     382ns     382ns  cuDeviceGetUuid

==18853== Unified Memory profiling result:
Device "Tesla T4 (0)"
   Count  Avg Size  Min Size  Max Size  Total Size  Total Time  Name
      48  170.67KB  4.0000KB  0.9961MB  8.000000MB  809.9640us  Host To Device
      24  170.67KB  4.0000KB  0.9961MB  4.000000MB  360.6320us  Device To Host
      12         -         -         -           -  2.564287ms  Gpu page fault groups
Total CPU Page faults: 36
If you increase just the number of threads to 256 (check the change in
<<<...>>>), and split correctly the work using the cuda varsthreadIdx.x(thread id in the block) andblockDim.x(number of threads in the block), as shown,__global__ void add(int n, float *x, float *y) { int index = threadIdx.x; int stride = blockDim.x; for (int i = index; i < n; i += stride) y[i] = x[i] + y[i]; }
// Run kernel on 1M elements on the GPU
  add<<<1, 256>>>(N, x, y);
then you get the following output
Quadro P1000 : From 2.5 secs to 0.022 secs!
==21739== NVPROF is profiling process 21739, command: ./a.out
Max error: 0
==21739== Profiling application: ./a.out
==21739== Profiling result:
            Type  Time(%)      Time     Calls       Avg       Min       Max  Name
 GPU activities:  100.00%  21.978ms         1  21.978ms  21.978ms  21.978ms  add(int, float*, float*)
      API calls:   87.86%  164.24ms         2  82.118ms  12.398us  164.22ms  cudaMallocManaged
                   11.76%  21.980ms         1  21.980ms  21.980ms  21.980ms  cudaDeviceSynchronize
                    0.24%  457.32us         2  228.66us  177.89us  279.43us  cudaFree
                    0.11%  206.80us       101  2.0470us     128ns  144.81us  cuDeviceGetAttribute
                    0.02%  29.041us         1  29.041us  29.041us  29.041us  cudaLaunchKernel
                    0.01%  20.149us         1  20.149us  20.149us  20.149us  cuDeviceGetName
                    0.00%  5.5860us         1  5.5860us  5.5860us  5.5860us  cuDeviceGetPCIBusId
                    0.00%  2.1000us         3     700ns     277ns     958ns  cuDeviceGetCount
                    0.00%     952ns         2     476ns     330ns     622ns  cuDeviceGet
                    0.00%     391ns         1     391ns     391ns     391ns  cuDeviceTotalMem
                    0.00%     259ns         1     259ns     259ns     259ns  cuDeviceGetUuid

==21739== Unified Memory profiling result:
Device "Quadro P1000 (0)"
   Count  Avg Size  Min Size  Max Size  Total Size  Total Time  Name
      48  170.67KB  4.0000KB  0.9961MB  8.000000MB  734.5940us  Host To Device
      24  170.67KB  4.0000KB  0.9961MB  4.000000MB  338.5950us  Device To Host
      24         -         -         -           -  1.764587ms  Gpu page fault groups
Total CPU Page faults: 36
Tesla T4: From 0.108 secs to 0.004 secs!
==21448== NVPROF is profiling process 21448, command: ./cuda_03.x
Max error: 0
==21448== Profiling application: ./cuda_03.x
==21448== Profiling result:
            Type  Time(%)      Time     Calls       Avg       Min       Max  Name
 GPU activities:  100.00%  3.7978ms         1  3.7978ms  3.7978ms  3.7978ms  add(int, float*, float*)
      API calls:   98.24%  291.22ms         2  145.61ms  73.005us  291.15ms  cudaMallocManaged
                    1.28%  3.8044ms         1  3.8044ms  3.8044ms  3.8044ms  cudaDeviceSynchronize
                    0.36%  1.0699ms         2  534.95us  512.29us  557.62us  cudaFree
                    0.08%  222.64us       101  2.2040us     174ns  102.62us  cuDeviceGetAttribute
                    0.02%  62.588us         1  62.588us  62.588us  62.588us  cudaLaunchKernel
                    0.02%  44.725us         1  44.725us  44.725us  44.725us  cuDeviceGetName
                    0.00%  8.1290us         1  8.1290us  8.1290us  8.1290us  cuDeviceGetPCIBusId
                    0.00%  3.2970us         3  1.0990us     266ns  2.6840us  cuDeviceGetCount
                    0.00%  1.7320us         2     866ns     352ns  1.3800us  cuDeviceGet
                    0.00%     632ns         1     632ns     632ns     632ns  cuDeviceTotalMem
                    0.00%     549ns         1     549ns     549ns     549ns  cuModuleGetLoadingMode
                    0.00%     377ns         1     377ns     377ns     377ns  cuDeviceGetUuid

==21448== Unified Memory profiling result:
Device "Tesla T4 (0)"
   Count  Avg Size  Min Size  Max Size  Total Size  Total Time  Name
      48  170.67KB  4.0000KB  0.9961MB  8.000000MB  825.8720us  Host To Device
      24  170.67KB  4.0000KB  0.9961MB  4.000000MB  360.3130us  Device To Host
      13         -         -         -           -  2.951606ms  Gpu page fault groups
Total CPU Page faults: 36
Cuda devices group parallel processors into Streaming Multiprocessors (SM), and each of them can run several threads in parallel. In our case, by using the command
deviceQuery(for the QuadroP1000 system it is at/opt/cuda/extras/demo_suite/deviceQuery), we getQuadro P1000: 5 SM, 128 threads/SM
Tesla T4: 32 SM, 128 threads/SM
So the ideal number of threads changes per card, and we will compute as
int blockSize = 128;
int numBlocks = (N + blockSize - 1) / blockSize; // what if N is not divisible by blocksize?
add<<<numBlocks, blockSize>>>(N, x, y);
Notice that you can also compute this constant by using the follow code (generated by bard.google.com)
// Get the number of threads per multiprocessor.
int threadsPerMultiprocessor;
cudaError_t err = cudaDeviceGetAttribute(&threadsPerMultiprocessor, cudaDevAttrMaxThreadsPerMultiprocessor, device);
if (err != cudaSuccess) {
  // Handle error.
}
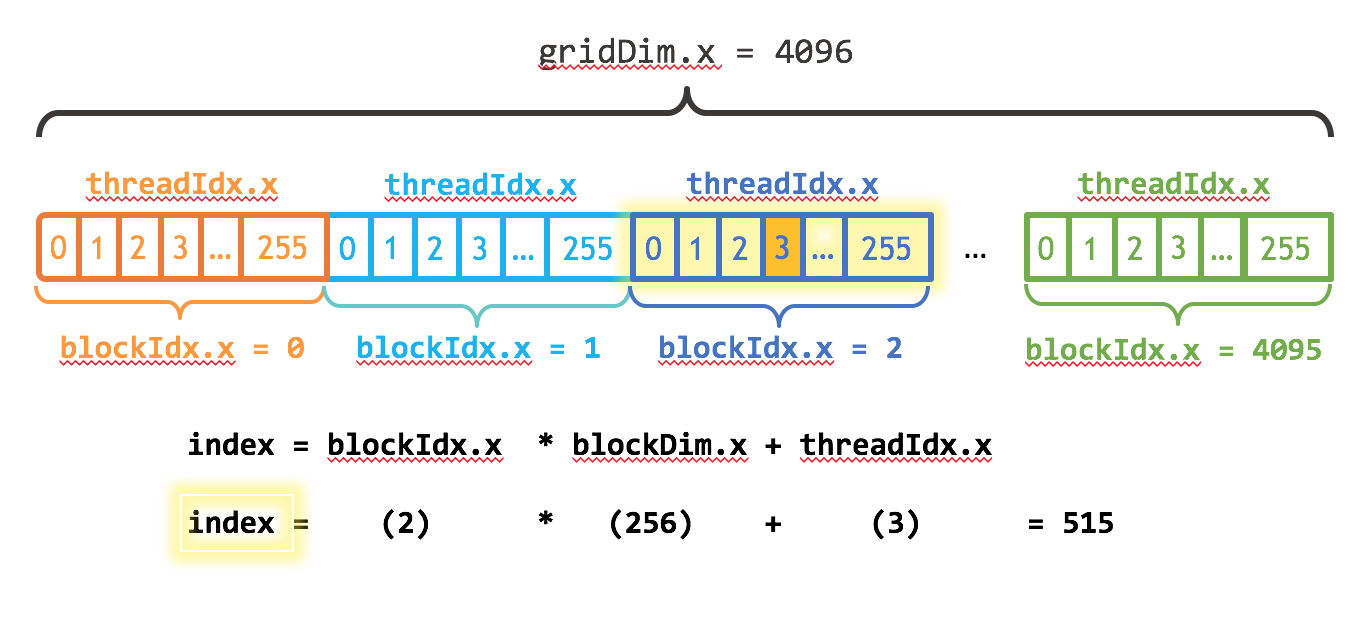
The kernel will now become
__global__
void add(int n, float *x, float *y)
{
  int index = blockIdx.x * blockDim.x + threadIdx.x;
  int stride = blockDim.x * gridDim.x;
  for (int i = index; i < n; i += stride)
    y[i] = x[i] + y[i];
}
based on the job distribution done by the tutorial https://developer-blogs.nvidia.com/wp-content/uploads/2017/01/cuda_indexing.png
Now we get
Nvidia Quadro P1000: From 2.500 to 0.022 to 0.006 secs!
==10662== NVPROF is profiling process 10662, command: ./a.out
Max error: 0
==10662== Profiling application: ./a.out
==10662== Profiling result:
            Type  Time(%)      Time     Calls       Avg       Min       Max  Name
 GPU activities:  100.00%  6.0868ms         1  6.0868ms  6.0868ms  6.0868ms  add(int, float*, float*)
      API calls:   96.03%  165.28ms         2  82.641ms  13.911us  165.27ms  cudaMallocManaged
                    3.54%  6.0887ms         1  6.0887ms  6.0887ms  6.0887ms  cudaDeviceSynchronize
                    0.27%  460.56us         2  230.28us  184.71us  275.85us  cudaFree
                    0.13%  215.37us       101  2.1320us     133ns  151.55us  cuDeviceGetAttribute
                    0.02%  30.822us         1  30.822us  30.822us  30.822us  cudaLaunchKernel
                    0.01%  22.122us         1  22.122us  22.122us  22.122us  cuDeviceGetName
                    0.00%  5.7430us         1  5.7430us  5.7430us  5.7430us  cuDeviceGetPCIBusId
                    0.00%  1.3810us         3     460ns     203ns     945ns  cuDeviceGetCount
                    0.00%     921ns         2     460ns     163ns     758ns  cuDeviceGet
                    0.00%     438ns         1     438ns     438ns     438ns  cuDeviceTotalMem
                    0.00%     234ns         1     234ns     234ns     234ns  cuDeviceGetUuid

==10662== Unified Memory profiling result:
Device "Quadro P1000 (0)"
   Count  Avg Size  Min Size  Max Size  Total Size  Total Time  Name
      59  138.85KB  4.0000KB  0.9961MB  8.000000MB  740.3880us  Host To Device
      24  170.67KB  4.0000KB  0.9961MB  4.000000MB  337.8280us  Device To Host
      32         -         -         -           -  2.253582ms  Gpu page fault groups
Total CPU Page faults: 36
Testla T4: From 0.108 to 0.004 to 0.003 secs
==8972== NVPROF is profiling process 8972, command: ./cuda_04.x
Max error: 0
==8972== Profiling application: ./cuda_04.x
==8972== Profiling result:
            Type  Time(%)      Time     Calls       Avg       Min       Max  Name
 GPU activities:  100.00%  2.9741ms         1  2.9741ms  2.9741ms  2.9741ms  add(int, float*, float*)
      API calls:   98.47%  250.63ms         2  125.31ms  38.785us  250.59ms  cudaMallocManaged
                    1.18%  2.9959ms         1  2.9959ms  2.9959ms  2.9959ms  cudaDeviceSynchronize
                    0.24%  613.16us         2  306.58us  302.27us  310.89us  cudaFree
                    0.07%  188.26us       101  1.8630us     169ns  86.068us  cuDeviceGetAttribute
                    0.02%  38.874us         1  38.874us  38.874us  38.874us  cuDeviceGetName
                    0.01%  37.051us         1  37.051us  37.051us  37.051us  cudaLaunchKernel
                    0.00%  5.7050us         1  5.7050us  5.7050us  5.7050us  cuDeviceGetPCIBusId
                    0.00%  2.2980us         3     766ns     224ns  1.8050us  cuDeviceGetCount
                    0.00%     979ns         2     489ns     195ns     784ns  cuDeviceGet
                    0.00%     587ns         1     587ns     587ns     587ns  cuDeviceTotalMem
                    0.00%     367ns         1     367ns     367ns     367ns  cuModuleGetLoadingMode
                    0.00%     324ns         1     324ns     324ns     324ns  cuDeviceGetUuid

==8972== Unified Memory profiling result:
Device "Tesla T4 (0)"
   Count  Avg Size  Min Size  Max Size  Total Size  Total Time  Name
     106  77.282KB  4.0000KB  980.00KB  8.000000MB  969.6510us  Host To Device
      24  170.67KB  4.0000KB  0.9961MB  4.000000MB  363.6760us  Device To Host
      11         -         -         -           -  2.908132ms  Gpu page fault groups
Total CPU Page faults: 36
18.3. TODO Openmp offload to gpu#
REF:
Code
#include <iostream>
#include <cstdio>
#include <omp.h>

int main()
{
    int a[100], b[100], c[100];
    int i;

    // Initialize arrays a and b
    for (i = 0; i < 100; i++) {
        a[i] = i;
        b[i] = 2 * i;
    }

    int num_devices = omp_get_num_devices();
    printf("Number of available devices %d\n", num_devices);

    // Offload computation to GPU
    #pragma omp target teams distribute parallel for map(to:a[0:100], b[0:100]) map(from:c[0:100])
    for (i = 0; i < 100; i++) {
        c[i] = a[i] + b[i];
    }

    // Print results
    for (i = 0; i < 100; i++) {
        std::cout << c[i] << " ";
    }
    std::cout << std::endl;

    return 0;
}
Does not work in sala2 due to the error
OpenMP GPU Offload is available only on systems with NVIDIA GPUs with compute capability >= cc70
It seems that sala2 compute capability is 6.1. It can be get with
nvidia-smi --query-gpu=compute_cap --format=csv
Using google collab I can compile it
!nvcc -arch sm_75 -O3 -o openmp_offload openmp_offload.cpp -lgomp
and get
Number of available devices 1
0 3 6 9 12 15 18 21 24 27 30 33 36 ...
Check:
/* Copyright (c) 2019 CSC Training */
/* Copyright (c) 2021 ENCCS */
#include <stdio.h>

#ifdef _OPENMP
#include <omp.h>
#endif

int main()
{
  int num_devices = omp_get_num_devices();
  printf("Number of available devices %d\n", num_devices);

  #pragma omp target
  {
      if (omp_is_initial_device()) {
        printf("Running on host\n");
      } else {
        int nteams= omp_get_num_teams();
        int nthreads= omp_get_num_threads();
        printf("Running on device with %d teams in total and %d threads in each team\n",nteams,nthreads);
      }
  }
  return 0;
}
18.4. TODO OpenACC intro#
REF:
https://enccs.github.io/OpenACC-CUDA-beginners/1.02_openacc-introduction/
https://ulhpc-tutorials.readthedocs.io/en/latest/gpu/openacc/basics/
Check if we are using the gpu or the cpu:
#include <stdio.h>
#include <openacc.h>

int main() {
  int device_type = acc_get_device_type();

  if (device_type == acc_device_nvidia) {
    printf("Running on an NVIDIA GPU\n");
  } else if (device_type == acc_device_radeon) {
    printf("Running on an AMD GPU\n");
    //} else if (device_type == acc_device_intel_mic) {
    //printf("Running on an Intel MIC\n");
  } else if (device_type == acc_device_host) {
    printf("Running on the host CPU\n");
  } else {
    printf("Unknown device type\n");
  }

  return 0;
}
Compile as
gcc -fopenacc mycode.c
Simple example:
#include <stdio.h>

int main() {
  int i;
  float a[100], b[100], c[100];

  // Initialize arrays
  for (i = 0; i < 100; i++) {
    a[i] = i;
    b[i] = i;
  }

  // Compute element-wise sum
  #pragma acc parallel loop
  for (i = 0; i < 100; i++) {
    c[i] = a[i] + b[i];
  }

  // Print result
  for (i = 0; i < 100; i++) {
    printf("%f\n", c[i]);
  }

  return 0;
}